chromium
Chrome 27 Beta: A Speedier Web and New HTML5 Forms
Today we launched Chrome 27 on the . This release introduces smarter behind-the-scenes resource scheduling and a few new features for web developers. Unless otherwise noted, updates apply to desktop versions of Chrome and Chrome for Android.
Faster page loads
Web content now appears on screen (on average) thanks to changes in Chrome’s resource scheduler. Starting with this release, the scheduler is more aggressive about using an idle connection and demoting the priority of preloaded resources so that they don’t interfere with critical assets. We’ve also added values from webpagetest.org to the list of metrics we use to measure improvements in page load time.
Elegant HTML5 date and time forms
The month, week, and date types now feature a simple, elegant user interface on desktop versions of Chrome, as shown in these screenshots from the datalist demo page:
- Add new comment
- Read more
- 76 reads
- Feed: Chromium Blog
- Original article
Blink: A rendering engine for the Chromium project
WebKit is a lightweight yet powerful rendering engine that emerged out of KHTML in 2001. Its flexibility, performance and thoughtful design made it the obvious choice for Chromium's rendering engine back when we started. Thanks to the hard work by all in the community, WebKit has thrived and kept pace with the web platform’s growing capabilities since then.
However, Chromium uses a different multi-process architecture than other WebKit-based browsers, and supporting multiple architectures over the years has led to increasing complexity for both the WebKit and Chromium projects. This has slowed down the collective pace of innovation - so today, we are introducing Blink, a new open source rendering engine based on WebKit.
This was not an easy decision. We know that the introduction of a new rendering engine can have significant implications for the web. Nevertheless, we believe that having multiple rendering engines—similar to having multiple browsers—will spur innovation and over time improve the health of the entire open web ecosystem.
- Add new comment
- Read more
- 202 reads
- Feed: Chromium Blog
- Original article
Discover Chrome DevTools - Our new interactive course
Today, we are launching Discover DevTools, an interactive Code School training course that will teach you how to take advantage of Chrome DevTool's powerful suite of resources and speed up the development and debugging of your web apps.
In each of the seven chapters of this interactive course, you can watch an overview video teaching you the latest techniques, and follow a series of challenges where your knowledge will be put to the test. We've integrated the Chrome DevTools themselves into the course, so as you explore the functionality within them, you'll get immediate feedback and earn points and badges.
- Add new comment
- Read more
- 71 reads
- Feed: Chromium Blog
- Original article
Pwnium 3 and Pwn2Own Results
Earlier this month at the CanSecWest security conference, the Chrome team took part in another Pwn2Own and hosted our third-edition Pwnium competition. This year’s participants once again impressed us with their talent and security prowess. We’re excited about what lessons we can learn from their work to make Chrome and Chrome OS even more secure.
At Pwnium, any winning entries, but did reserve the right to issue “partial” rewards. We’re pleased to reward $40,000 to Pinkie Pie, who submitted a plausible bug chain involving video parsing, a Linux kernel bug and a config file error. The submission included an unreliable exploit demonstrating one of the bugs. We’ve fixed most of these bugs already.
In particular, we’d like to thank Pinkie Pie for honoring the spirit of the competition by disclosing a partial exploit at the deadline, rather than holding on to bugs in lieu of an end-to-end exploit. This means that we can find fixes sooner, target new hardening measures and keep users safe.
In the parallel Pwn2Own contest, participants attacked many different browsers and plug-ins. There was a top prize on the line for Chrome, which was claimed by Nils and Jon of MWR Labs. Of the two bugs used, one bug was in Chrome code, which we fixed in 24 hours. Thankfully, recently deployed hardening measures protected Chrome OS users. The second bug was in the Windows kernel. The new Pwn2Own rules required the researcher to hand the bug and exploit over to Microsoft, so we’re delighted that the Chrome entry will make other products safer, beyond just Chrome.
While these security gatherings and live competitions are fun, we also want to highlight the ongoing Chromium Vulnerability Reward Program, which covers not only the Chrome desktop browser, but also all Chrome OS components and Chrome on mobile devices. We’ve given away more than $900,000 in rewards over the years and we’re itching to give more, as engaging the security community is one of the best ways to keep all Internet users safe.
- Add new comment
- Read more
- 678 reads
- Feed: Chromium Blog
- Original article
New Asynchronous APIs for Dart
The latest Dart SDK now provides a cohesive API for asynchronous programming. Some of the new or improved classes in this release include Stream, a sequence of asynchronous events, and Future, a single asynchronous result.
The Stream class is new and delivers on a for a more unified approach to events. An event can be any Dart object, which makes Streams very flexible. Consumers of a Stream can listen for events, and streams can be piped, transformed, filtered, and more. We are working to apply them across HTML, I/O, isolates, and more. Here is an example of using streams with the HTML library, treating clicks as a stream of events:
query('#button').onClick.listen((e) => submitForm());
Here is an example of streaming the contents of a file. Notice how streams can be transformed.
- Add new comment
- Read more
- 104 reads
- Feed: Chromium Blog
- Original article
Data Compression in Chrome Beta for Android
Today’s Chrome Beta for Android update brings your saved passwords and autofill entries from your desktop to your phone and tablet. This release also introduces an experimental data compression feature that will yield substantial bandwidth savings. This feature is powered by a connection to a SPDY proxy running on Google’s servers, paired with content optimization performed by our , specifically tuned for Chrome Beta on Android.
- Add new comment
- Read more
- 117 reads
- Feed: Chromium Blog
- Original article
Faster web pages thanks to better compression
Today, we released the Zopfli Compression Algorithm, a C library that compresses existing web content 3–8% more densely.
is compatible with the normal decompression mechanisms already present in web browsers and uses a much slower but more exhaustive compression algorithm than, for example, the zlib library. This can result in smaller data sizes and faster web pages.
To learn more about Zopfli, visit .
- Add new comment
- 81 reads
- Feed: Chromium Blog
- Original article
On the track with Chrome Super Sync Sports
Earlier today we launched Chrome Super Sync Sports. It’s an interactive web game that enables up to four friends to compete in running, swimming and cycling events on a shared computer screen, using their smartphones or tablets as game controllers.
Chrome Super Sync Sports was built with the latest browser technologies:
- Add new comment
- Read more
- 89 reads
- Feed: Chromium Blog
- Original article
Chrome 26 Beta: Template Element & Unprefixed CSS Transitions
Today’s Chrome Beta channel release includes a slew of awesome new features to help you make your web apps more powerful and beautiful. Unless otherwise noted, all updates apply to Chrome for Windows, Mac, Linux and Android.
Element element is part of , a set of cutting edge standards that will make it possible to build reusable widgets for the web. The element allows you to store HTML fragments that you intend to use for any reason at any time during the lifetime of your page, but that aren’t ready or shouldn’t be used during page load. Here’s an illustrative code snippet from the HTML5 Rocks article:
- Add new comment
- Read more
- 74 reads
- Feed: Chromium Blog
- Original article
Chrome app launcher developer preview
Today, on the Chrome dev channel for Windows, you can try the Chrome app launcher--a dedicated home for your apps which makes them easy to open outside the browser. This is the same experience as the app launcher on Chromebooks, but for other platforms. It’s available on Windows now, and will be coming to Mac OS X and Linux soon.
You’ll need to install a Chrome packaged app, such as IRC client or , in order to try out the Chrome app launcher. Chrome packaged apps deliver a native-like experience across multiple platforms with the security properties of a web page. Just like web apps, packaged apps are written in HTML, JavaScript, and CSS. But packaged apps launch outside the browser, work offline by default, and have access to powerful APIs not available to web apps.
- Add new comment
- Read more
- 65 reads
- Feed: Chromium Blog
- Original article
Using WebP to Improve Speed
Since speed is critical for a good experience when using the web, at Google we’re always exploring ways to make the web faster. As it turns out, one of the biggest bang-for-the-buck ways to do that is by replacing JPEG and PNG images with . WebP offers significantly better compression than these legacy formats (around in most cases), and when you consider that over 60% of typical page sizes are images, the benefits can be substantial. WebP translates directly into less bandwidth consumption, decreased latency, faster page loads, better battery consumption on mobile, and overall happier users.
Case in point: the uses many large promotional images and tiles on its home page, making it a very heavyweight page. The team was eager to find ways to improve its speed, without sacrificing the user experience or giving up image quality. WebP to the rescue!
- Add new comment
- Read more
- 3561 reads
- Feed: Chromium Blog
- Original article
Updates to manifest V1 Chrome Web Store items to be blocked in March
Last year, Chrome introduced manifest V2 to Apps and Extension developers, which brings a variety of security and API improvements such as a default Content Security Policy. As of Chrome 18, manifest V1 was officially deprecated. At the time, we published our manifest version support schedule to give developers transparency and insight into our plans for migrating to the new version.
Today, we’re announcing a slight update to that schedule, to let developers know that they have until Monday, March 4, 2013 to make updates to their existing manifest V1-based items. After that date, the will block all updates to products based on manifest V1 unless the update includes switching it to manifest V2.
- Add new comment
- Read more
- 789 reads
- Feed: Chromium Blog
- Original article
Introducing “Find Your Way to Oz”, a new Chrome Experiment
Earlier today we unveiled Find Your Way To Oz, a new Chrome Experiment inspired by the upcoming feature film Oz The Great and Powerful. Developed by UNIT9, this experiment brings together Disney’s unique storytelling tradition and the power of the web platform, allowing users to interact with the web in a completely new way.
The desktop version of “Find Your Way To Oz” uses many of the open web’s more advanced features:
- Immersive Graphics: The experiment uses WebGL for the main 3D environment, CSS3 features such as CSS Transitions for various visual embellishments, and GLSL shaders for the tornado’s ominous look and feel.
- Rich Audio: As the user explores the experiment, the 3D sound dynamically adapts thanks to the Web Audio API. The same API powers the experiment’s music composing section.
- Camera-based interactions: Through WebRTC’s getUserMedia API, users can become circus characters or record their own mini-movies.
The experiment’s mobile web version also uses cutting-edge web technologies. These include graphics features such as accelerated 3D transforms and sprite sheets as well as mobile hardware features like camera, multi-touch, gyroscope and accelerometer. Together they create an experience that can normally only be found in native apps.
To learn more about how this experiment was built, read our technical case study and join us for a Google Developers Live event on February 11th at 11 a.m. GMT where we’ll be talking to the team behind the project. Alternatively, use Chrome’s to see how the experiment works on your own, perhaps finding in the process your own path to the yellow brick road.
- Add new comment
- Read more
- 750 reads
- Feed: Chromium Blog
- Original article
Hello Firefox, this is Chrome calling!
For the first time, Chrome and Firefox can “talk” to each other via WebRTC. WebRTC is a new set of technologies that brings clear crisp voice, sharp high-definition (HD) video and low-delay communication to the web browser.
From the very beginning, this joint WebRTC effort was embraced by the open web community, including engineers from the Chrome and Firefox teams. The common goal was to help developers offer rich, secure communications, integrated directly into their web applications.
In order to succeed, a web-based communications platform needs to work across browsers. Thanks to the work and participation of the W3C and IETF communities in developing the platform, Chrome and Firefox can now communicate by using standard technologies such as the Opus and VP8 codecs for audio and video, DTLS-SRTP for encryption, and ICE for networking.
To try this yourself, you’ll need desktop and Firefox Nightly for Desktop. In Firefox, you'll need to go to about:config and set the media.peerconnection.enabled pref to "true”. Then head over to the WebRTC demo site and start calling.
For developers looking to include this functionality in their own apps, there are a few places you can go to get more information. You can look at the of the AppRTC demo, a that makes writing cross-browser WebRTC apps a snap, and a document detailing some of the minor differences between browsers.
You can read more from Mozilla’s hacks blog here and view our first “Official” call at the video below:
- Add new comment
- Read more
- 990 reads
- Feed: Chromium Blog
- Original article
Show off Your Security Skills: Pwn2Own and Pwnium 3
Security is one of the core tenets of Chrome, but no software is perfect, and security bugs slip through even the best development and review processes. That’s why we’ve continued to engage with the security research community to help us find and fix vulnerabilities. Recently, HP’s Zero Day Initiative (ZDI) announced details for the annual Pwn2Own competition, to be held at the CanSecWest security conference taking place March 6-8 in Vancouver, BC. This year we’ve teamed up with ZDI by working together on the Pwn2Own rules and by underwriting a portion of the winnings for all targets. The new rules are designed to enable a contest that significantly improves Internet security for everyone. At the same time, the best researchers in the industry get to showcase their skills and take home some generous rewards.
Today we’re announcing our third Pwnium competition—Pwnium 3. Google Chrome is already featured in the Pwn2Own competition this year, so Pwnium 3 will have a new focus: Chrome OS.
We’ll issue Pwnium 3 rewards for Chrome OS at the following levels, up to a total of $3.14159 million USD:
- Add new comment
- Read more
- 89 reads
- Feed: Chromium Blog
- Original article
Native Client support on ARM
(NaCl) enables Chrome to run high-performance apps compiled from your C and C++ code. One of the main of Native Client is to be architecture-independent, so that all machines can run NaCl content. Today we’re taking another step toward that goal: our now supports ARM devices, from and onwards.
If your app uses Native Client and newlib, you’ll now be able to reach users on ARM devices by simply adding an ARM .nexe to your app and making a small adjustment to the Native Client . Just get the newest SDK, and you’ll have all the tools you need.
- Add new comment
- Read more
- 99 reads
- Feed: Chromium Blog
- Original article
Google Search in Chrome gets more secure
Today, when users are signed in to Google, Chrome sends their searches from the Chrome address bar (“”) over (SSL). Starting with Chrome 25 (currently in the Dev and Beta channels), we’re doing the same thing for Chrome omnibox searches performed by users who aren’t signed in to Google.
Serving content over SSL provides users with a more secure and private search experience. It helps ensure that malicious actors who might intercept people’s internet traffic can’t see their queries. Many major sites have begun serving content over SSL by default, such as Gmail in early 2010, Twitter in February 2012, and Facebook in November 2012. Search has also been moving toward encryption. Google introduced Encrypted Search in May 2010 and made encryption the default for signed-in users starting in October 2011. Firefox announced a switch to SSL for all Google searches in July 2012, and Safari did the same thing in September 2012. Chrome is continuing this trend.
- Add new comment
- Read more
- 126 reads
- Feed: Chromium Blog
- Original article
Chrome 25 Beta: Content Security Policy and Shadow DOM
Earlier today we released Chrome 25 on the , and last week we introduced the Beta channel for Chrome for Android. To kick off the new year, we’ve packed these releases full of developer features. You’ll find all the updates described here in both the desktop and Android releases unless otherwise noted.
Unprefixed support for Content Security Policy
Content Security Policy (CSP) helps you reduce the risk of cross-site scripting and other content injection attacks. Starting in today’s Beta release, you can use the unprefixed Content-Security-Policy HTTP header to define a whitelist of trusted content sources. The browser will only execute or render resources from those sources. For example:
- Add new comment
- Read more
- 120 reads
- Feed: Chromium Blog
- Original article
Beta Channel Arrives for Android Phones and Tablets
Starting today, you can install Chrome Beta channel for phones and tablets on Android 4.0+ from . This release includes some of the biggest developer updates to Chrome for Android since its launch last year, bringing many features available on other Chrome versions to Android as well:
- Add new comment
- Read more
- 90 reads
- Feed: Chromium Blog
- Original article
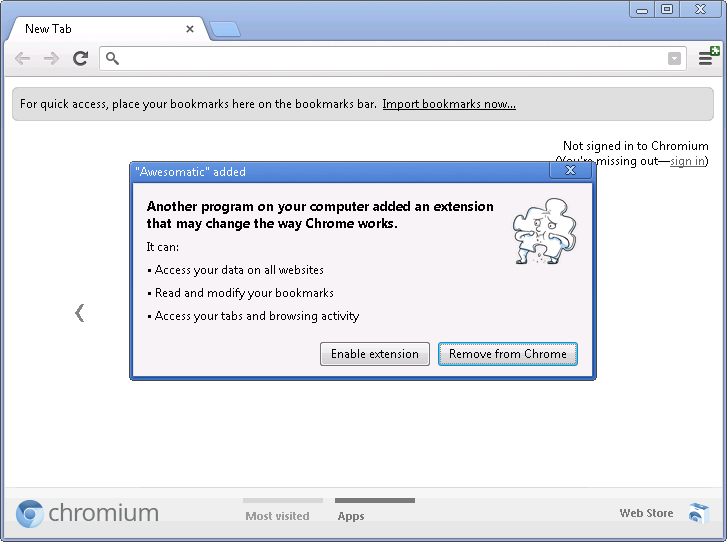
No more silent extension installs
It’s important for users to know what extensions they have enabled since extensions can sometimes influence Chrome’s functionality and performance. Many users have installed extensions from the Chrome Web Store, but some users have extensions that were silently installed without their knowledge.
Until now, it has been possible to silently install extensions into Chrome on Windows using the Windows registry mechanism for extension deployment. This feature was originally intended to allow users to opt-in to adding a useful extension to Chrome as a part of the installation of another application. Unfortunately, this feature has been widely abused by third parties to silently install extensions into Chrome without proper acknowledgment from users.
Two new features in Chrome 25 will help users run only the extensions they want to use:
Extensions installed by third party programs using external extension deployment options will be disabled by default. When a third party program installs an extension, the Chrome menu will be badged, and users can click through the Chrome menu to see a dialog containing an option to enable the extension or to remove it from their computer.
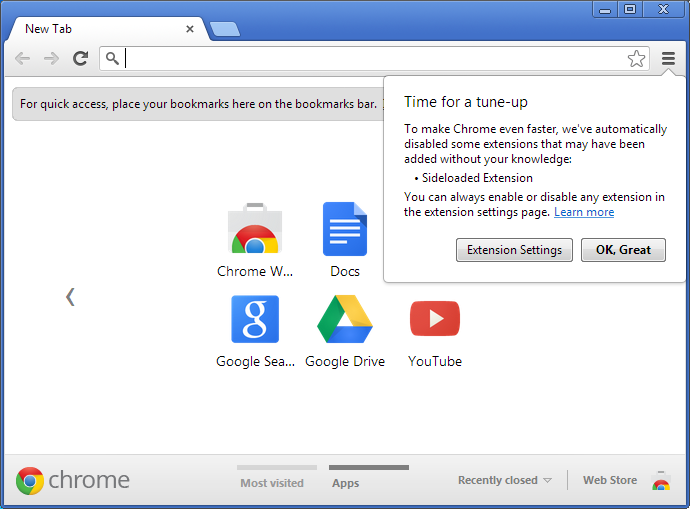
In addition, all extensions previously installed using external deployment options will be automatically disabled. Chrome will show a one-time prompt to allow the re-enabling of any of the extensions.
Windows application developers should ask users to install Chrome extensions from within Chrome. A great way to allow users to install a Chrome extension related to your Windows application is to link users to your website and use .
- Add new comment
- Read more
- 879 reads
- Feed: Chromium Blog
- Original article
- 1
- 2
- 3
- 4
- 5
- 6
- 7
- 8
- 9
- …
- next ›
- last »